More Raspberry Pi Pico experiments
If you're exploring the Raspberry Pi pico, here are some more resources
MicroPlot
I've started a new project called MicroPlot. It's been developed on the Pico though it will eventually work on other micro-controllers and computers. It's a minimal plotting package and it already has enough functionality to be useful.
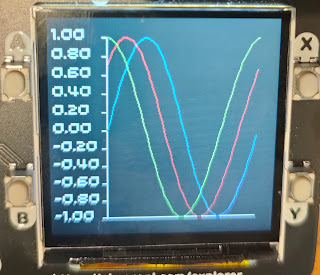
It will plot simple line plots; the first example below is a series if sine waves and the second shows the voltage across a capacitor as it charges and discharges.
 |
| Plotting Sine waves |
 |
| Capacitor charging and discharging |
MicroPlot has its own project on GitHub. You can read about it and download the code at https://github.com/romilly/microplot and I will be soon be using it for some more electronics experiments.
Using the UART
The Tiny2040 is available from Pimoroni!
 |
| Pimoroni Tiny2040 |
src/pico_code/pico/tiny2040/directory.
Resistomatic
Over the years I've blogged about a number of implementations of resistomatic, a home-made resistance meter. Most of them use an 8-bit ADC which complicates the design because 8 bits give a low resolution. The pico's ADCs are 12-bit. My crude design just needs a bridge that compares the voltages across the reustor to be measured and a know 1K ohm resistor. It's accurate enough (5%) for my purposes across a range of resistance. I've checked it with resistors ranging from 56R to 100K ohms.
You'll find the code and little more information at https://github.com/romilly/pico-code/blob/master/docs/resistomatic.md
More on the way
I've several more Pico projects in the pipeline. To stay up-to-date as I release them, follow @rareblog on twitter.
set up a new GitHub


Comments
Post a Comment